LLM Cost Comparison: How to Evaluate ROI for Coding Agents
LLM cost comparison guide for engineering teams. See real per-card pricing data, token economics, and ROI methods to pick the right model for coding agents.

In this article
- Why Per-Token Pricing Misleads Engineering Teams
- Count the work that reaches production
- The Falling Cost of Inference Over Time
- Normalize price by capability
- Opus 5.5 vs Sonnet 5.5 on Real Cards
- Why headline rates diverge from card economics
- Cost per Solved Problem Across Seven Models
- What the spread actually tells you
- Route by task instead of declaring one winner
- Hidden Costs That Invert the Leaderboard
- The costs rate cards leave out
- Running a Statistically Credible Model Comparison
- A repeatable experiment design
- Designing a Model Strategy That Survives Price Shifts
- Build portability into the workflow
- Routing and ROI Recommendations for Coding Agents
A cheaper model can lower the bill and still create more work. In one workflow, switching from Opus 5.5 to Sonnet 5.5 cut average cost per card from $17.34 to $3.48, an 80% saving, across more than 100 cards. But fix rounds rose from 0.4 per card with Opus to 1.6 with Sonnet 5.5.
That is the tradeoff. A cheaper model can cost less per call and more per finished task if your team spends extra time reviewing, fixing, and retesting the work.
For coding agents, the best unit is not tokens. It is a finished work item, such as a merged pull request or accepted card. The real question is simple: which model gets accepted work done at the lowest full cost?
Why Per-Token Pricing Misleads Engineering Teams
The Loupe experiment shows why token tables can mislead teams. Replacing Opus 5.5 with Sonnet 5.5 during implementation cut average cost from $17.34 to $3.48 per card, an 80% drop, across more than 100 cards. But Opus averaged 0.4 fix rounds per card, while Sonnet 5.5 averaged 1.6.
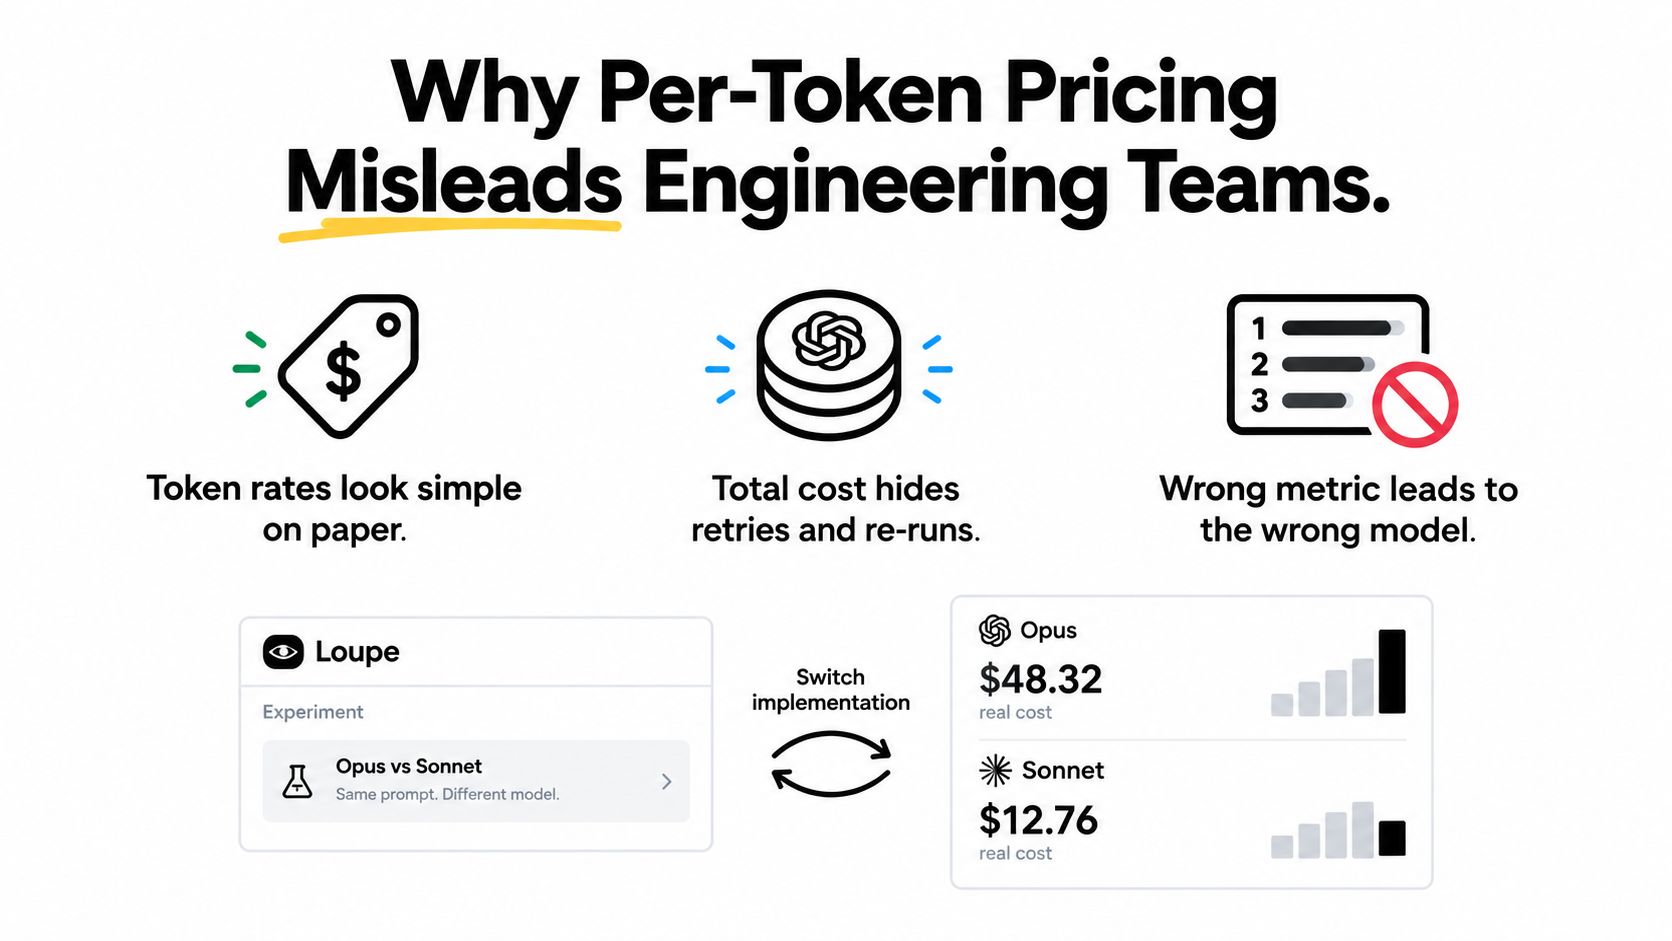
So the key question is not, “Which model is cheapest per token?” It is, “What does it cost to get an accepted change?”
Count the work that reaches production
A coding-agent workflow includes more than model calls:
Context assembly: files, notes, and prior feedback
Tool execution: reads, edits, tests, builds
Correction cycles: failed runs trigger more passes
Human review: engineers inspect and fix output
Merge completion: value comes from accepted work
A cheap model can become expensive if it needs more retries or takes longer to review. A pricier model can be worth it if it reduces repair work.
Practical rule: Use token rates to estimate spend, then use cost per accepted change to choose the model.
Track fix rounds, merge rate, cycle time, and human intervention next to cost per card. Those numbers explain whether lower spend also improved delivery.
The Falling Cost of Inference Over Time
Model pricing changes fast. Stanford's 2025 AI Index report says inference for a model at GPT-3.5-level performance, measured at 64.8% on MMLU, fell from $20 per million tokens in November 2022 to $0.07 per million tokens in October 2024. The October 2024 result was tied to Google's Gemini-1.5-Flash-8B, a drop of more than 280 times.
That means price tables age quickly. A premium capability today may be cheap later.
Normalize price by capability
A lower token price matters only if the model can do the job at the same quality level. The same AI Index report says inference costs have fallen 9 to 900 times per year, depending on the task and capability target.
For engineering teams, cost has three layers:
Token cost
Workflow cost, including retries, tools, and review
Outcome cost, measured per accepted card or merged change
Models change fast. Finished work is the better unit to track.
Opus 5.5 vs Sonnet 5.5 on Real Cards
This test used a controlled workflow. Only the implementation model changed. Planning, review, and fix phases stayed the same across more than 100 cards.
| Metric | Opus 5.5 | Sonnet 5.5 | Change |
|---|---|---|---|
| Average cost per card | $17.34 | $3.48 | $13.86 lower, 80% saving |
| Fix rounds per card | 0.4 | 1.6 | 1.2 more rounds |
| Implementation model | Opus 5.5 | Sonnet 5.5 | Only implementation changed |
The result is clear. Sonnet 5.5 cost less per card. Opus 5.5 needed fewer fixes.
Why headline rates diverge from card economics
A late-2025 Claude API pricing comparison lists Claude Sonnet 4.5 at $3 per million input tokens and $15 per million output tokens, compared with Claude Opus 4.5 at $5 input and $25 output. That helps for context, but it does not show the cost of a finished task.
Agent runs can include long prompts, repeated tool calls, retries, and fix prompts. Human review adds more cost. So a model that looks cheap on paper may cost more in practice.
The best model is the one that gets accepted work done at the lowest full cost.
Cost per Solved Problem Across Seven Models
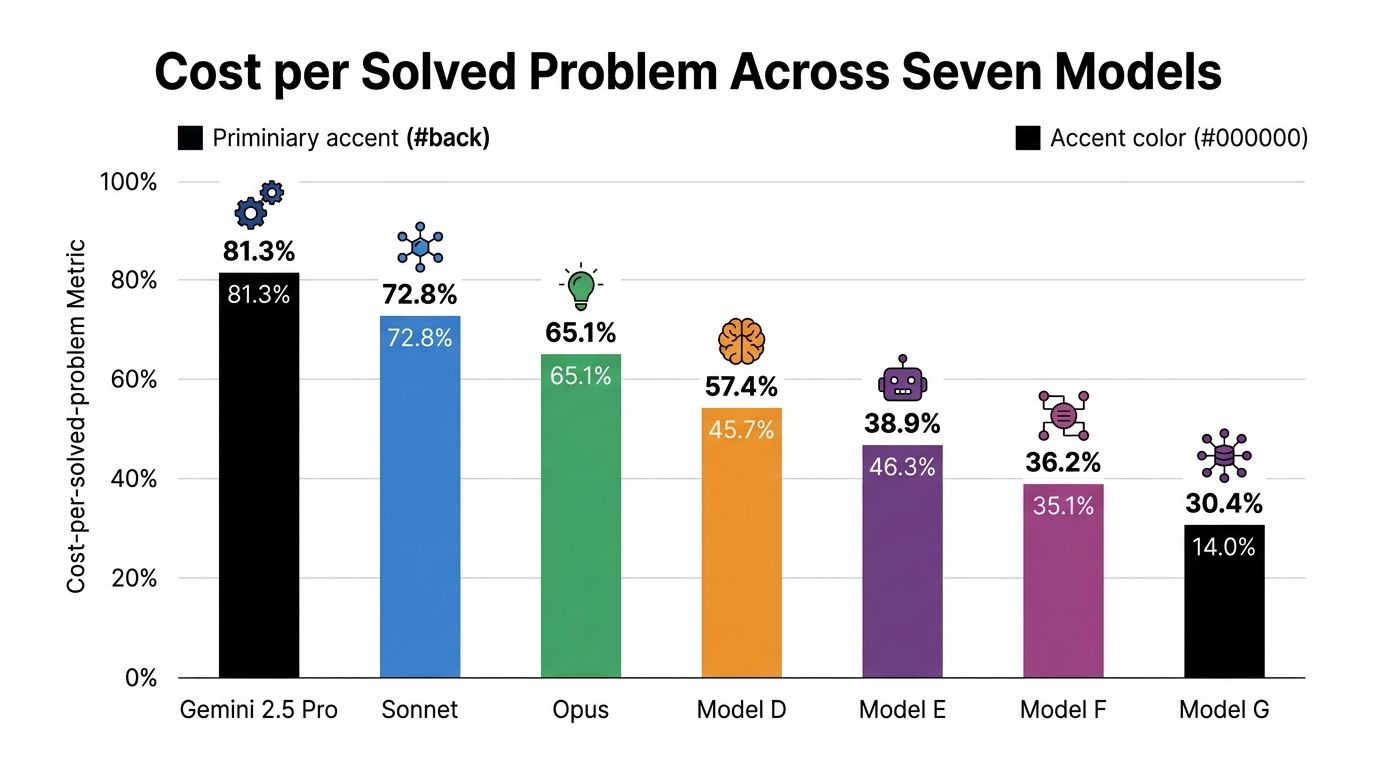
A 2026 empirical study of seven LLMs on data-science coding tasks shows the same pattern. Gemini 2.5 Pro had the highest overall success rate at 81.3% and a Pass@1 of 62.2%, but its median cost was $0.10740 per solved problem. Qwen3-Coder cost $0.00034 per solved problem, about 316 times less.
The other reported costs were $0.00951 for GPT-4.1, $0.01725 for Perplexity Sonar, $0.01735 for GPT-4o, $0.02184 for o3-mini, and $0.02192 for Claude Sonnet 4.5, according to the published empirical study.
What the spread actually tells you
The cheapest model was not the best model overall. The best model was not the cheapest. That is normal.
A solved benchmark task is also not the same as a merged software change. In production, you also pay for context, tool use, tests, code review, and fix cycles.
To use a benchmark like this, translate it into your own workflow. Measure cost per merged pull request or cost per accepted card, not just token spend.
Route by task instead of declaring one winner
Different tasks can justify different models. A cheaper model may work well for routine edits, test generation, classification, summarization, or simple review. A premium model may be worth it for hard architecture choices or risky implementation work.
Do not ask which model is best in general. Ask which model gives the right result at the right cost for each task type.
Hidden Costs That Invert the Leaderboard
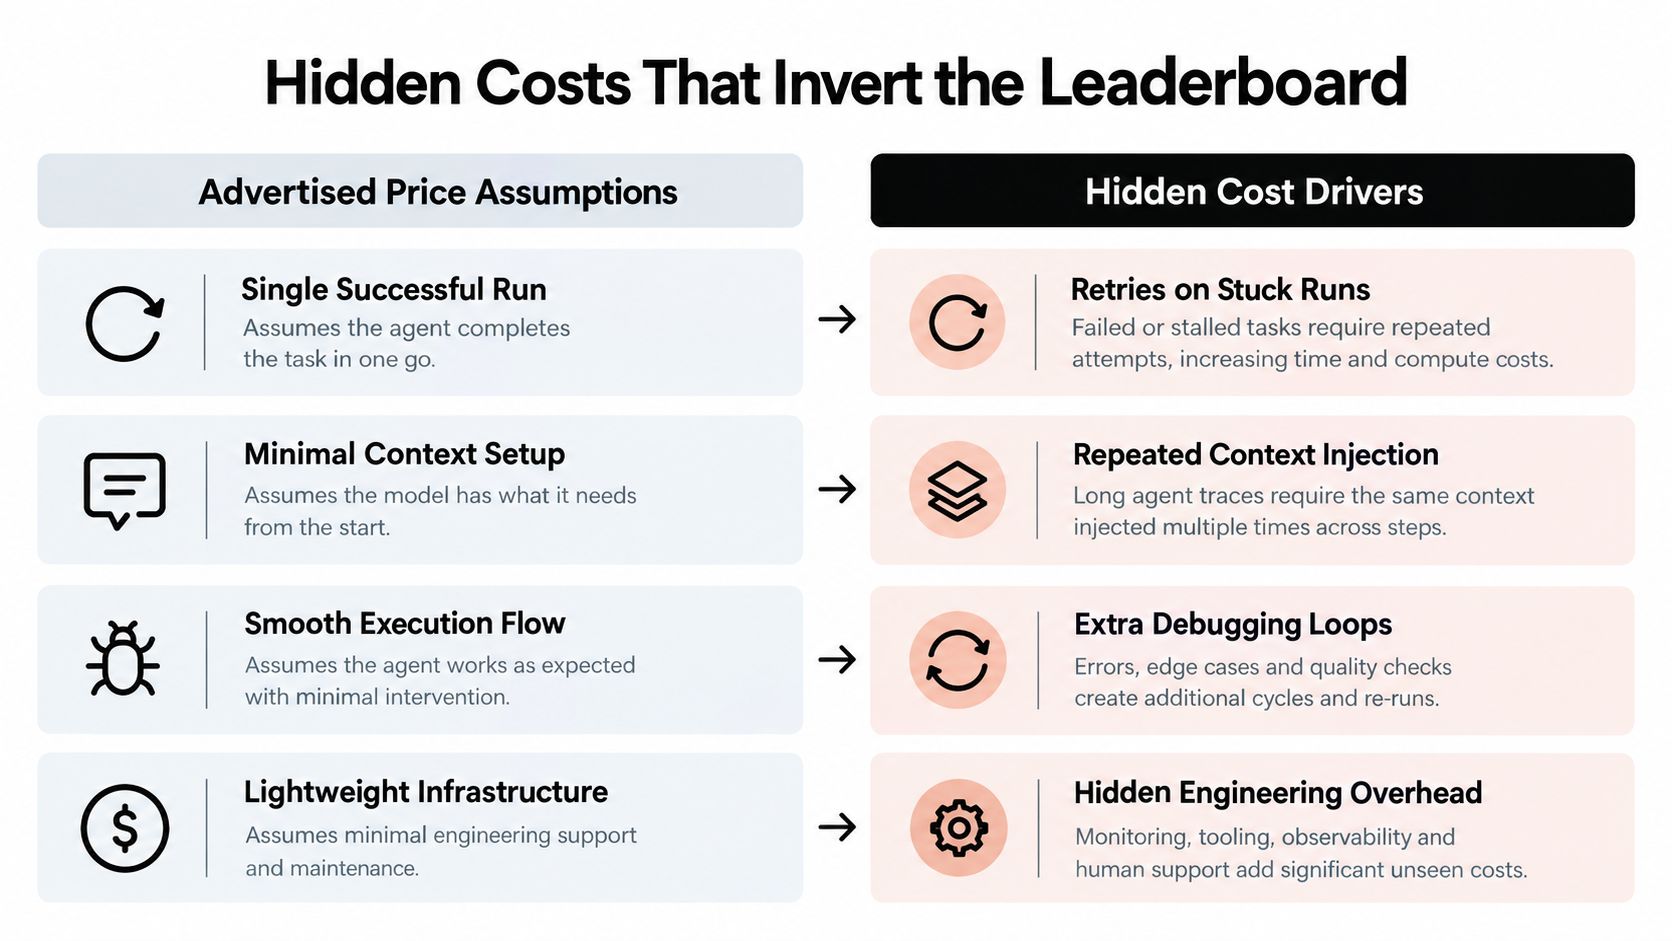
Advertised token prices are only a starting point. A 2026 cross-provider price-performance dataset covering 453 model endpoints from 47 providers found prices from $0.02 to $262.50 per million blended tokens. Even that does not tell you the cheapest way to get a reliable software change.
The costs rate cards leave out
Rate cards miss several real costs:
Retries on failed runs
Repeated context injection
Tool and runtime costs
Human review time
Latency and availability issues
A concurrency-aware study also found that serving cost can change a lot with utilization. Mixtral FP16 cost $15.25 per million output tokens at one request per second, close to a $15.00 commercial tier, but $3.16 per million output tokens at five requests per second as fixed costs were spread over more traffic.
So do not measure only per-request cost. Measure queue behavior, latency, retries, and completed cards together.
Measure the queue, not just the request.
Running a Statistically Credible Model Comparison
A useful experiment changes one important variable and keeps the rest fixed. In the Opus 5.5 versus Sonnet 5.5 test, only the implementation model changed. Planning, review, and fix phases stayed the same across more than 100 cards.

If you change prompts, reviewers, and card mix at the same time, you cannot tell what caused the result.
A repeatable experiment design
Use this structure:
Pick the main outcome first. Use accepted-card cost, merge rate, fix rounds, or cycle time.
Change only one key variable. In most cases, that should be the model.
Use real, mixed-difficulty cards.
Set a win threshold before the test.
Track quality and cost together.
Guidance on designing credible prompt experiments suggests at least 30 requests per variant, ideally 100 or more, a 95% confidence level or p < 0.05, and a predefined winning threshold such as 5%.
This test gave a split result, and that is still useful. Sonnet 5.5 won on cost per card. Opus 5.5 won on fewer fix rounds.
Designing a Model Strategy That Survives Price Shifts
Model economics move fast. BenchLM's pricing analysis reports that frontier token prices fell 84.5% from a March 2023 baseline by October 2026, with a median blended price of about $5.81 per million tokens across 36 flagship models. The same source reports spreads of more than 600 times between major APIs and notes that some providers use peak and off-peak pricing.
That makes one-time model decisions risky. Prices shift, models retire, and provider policies change.
Build portability into the workflow
A better strategy is to make model choices easy to swap. OpenRouter-style routing, OpenAI-compatible interfaces, and separate model configuration can reduce switching work.
Keep a test set based on real cards. Store prompts, context, acceptance criteria, review results, and cost data so you can rerun comparisons when models change.
Useful safeguards:
Versioned evaluations
Model aliases with audit trails
Cached context where appropriate
Continuous monitoring
Fallback routes
The Loupe blog is a useful place to follow workflow-focused thinking about agentic software delivery, but the bigger lesson is simple: keep your measurement system stable and your model choices flexible.
Routing and ROI Recommendations for Coding Agents
Use cheaper models for high-volume, low-risk work when quality is good enough. Good examples include mechanical review, test generation, summarization, and simple design revisions.
Use premium reasoning models for ambiguous architecture, failure-prone implementation, and high-stakes review points when they reduce downstream repair.
Track these together:
Cost per finished card
Merge rate
Fix rounds
Hours to merge
Human intervention
The cheapest model is not the one with the lowest token rate. It is the one that gets accepted work done at the lowest full cost.
Re-run the comparison when a provider retires a model or changes pricing in a major way. Keep the workflow controlled and route by task, not by habit.
Loupe gives teams a board-based workflow for coordinating coding agents across product design, technical design, implementation, review, and pull requests, with analytics for cost per finished card, merge rate, fix rounds, and hours to merge. Visit Loupe to see how outcome-based model experiments can fit directly into an agent-driven software delivery process.
Produced via Outrank tool